|

Advertisements
Advertising agents specialise in writing advertisements. Their
job is to help the manufacturer sell his product.
Sometimes they may use statistics.
Make a collection of advertisements that use statistics.
- What do you think of'the way they use statistics?
You will see that advertisers sometimes use statistics in
devious ways. We now look at some fictitious advertisements to
see more clearly how statistics are misused. We call the
advertising agency Sly Sellers and the product
Catchunks.
First Advertisement for Catchunks
In January 1979 Catchunks published the advertisement shown in
Figure 1.

Figure 1 - First advertisement for Catchunks.
How does this advertisement mislead?
There are several organizations which try to find out the real
facts. One of these we call Fact Ferrets. Their first
job is to get the correct figures in standard units. These are
shown in Table 1.
Table 1 - Content of Catchunks
and average cat food (standard units).
In the Catchunks advertisement no units were given.
Figure 2 shows three ways of putting
the units on a bar chart showing the protein content.

Figure2 - Protein content of Catchunks and average
cat food: three charts
Look at the three charts in Figure 2.
- Which chart makes Catchunks look much better than
average cat food?
- Which chart is the fairest? Why are the others
not fair?
- Using all the figures found by Fact
Ferrets, draw a fair bar chart for
the Catchunks advertisement.
Remember to use bars the same width. label your chart 'Food
content of average cat food and Catchunks'.
- Compare your bar chart with the January
advertisement. Which is the fairer? In what ways have Sly
Sellers distorted their charts.
- Using the figures for 'phosphorus' from Table 1,
draw a misleading diagram to show that the average cat
food is much better than Catchunks.
March Advertisements for Catchunks
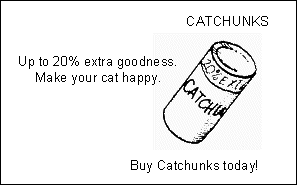
In March Catchunks used two different advertisements. These
are shown in Figure 3.


Figure 3 - March advertisments for Catchunks.
Fact Ferrets looked at the first March advertisement.
Thev knew that the usual price of a tin of Catchunks was 25p.
They did not agree that there was a saving of 50%
- Copy and complete the following to find out why.
Price of one tin of Catchunks = 25p
Cost of three tins bought separately = 25p x 3 = _____ p
Cost of two tins (plus one free tin) = 25p x2 = _____ p
Amount saved with the one free tin _____ p
Fraction saved when buying three tins: = amount saved /
cost of 3 tins bought seperately = _____
- Change this fraction to a percentage.
Fact Ferrets, did not like the second March
advertisement either. They, said that 10% or even 0% was included
in the phrase 'up to 20%'.
- What do you think 'up to 20% extra' might mean?
June Advertisement for Catchunks
You will need a sheet of graph paper.
In June Sly Sellers tried to persuade people to buy
more Catchunks by showing how sales figures had increased. Figure 4 shows their advertisement.

Figure 4 - June advertisement for Catchunks.
Fact Ferrets found the true sales figures, which are
shown in Table 2.
Table 2 - Sales of Catchunks,
1975 to 1978.
- Plot the figures from Table
2 on a graph. Use a vertical axis
from 0 to 300 thousand tins with a scale of 50 thousand
tins per centimetre square.
- Draw another graph of the sales figures. This
time use a vertical axis from 200 to 220 thousand tins
with a scale of 5 thousand tins per centimetre square.
- Which graph do you think was used in the June
advertisement? Why?
- Which is the fairer graph to use?
- How have Sly Sellers
made the graph in their advertisement misleading?
More Deceit
Fact Ferret. found more in these advertisements
designed to mislead. Some of their comments and questions are
given below.
- Think about each and write two or three sentences
saving what you think.
January Advertisement
- What is the'average'cat food'? - his average cat food had
fewer of the nutrients than Catchunks. Does this mean all
cat foods are worse than Catchunks?
- 'Cats prefer Catchunks'. What evidence is there for this?
How could you find out?
- Catchunks may contain less of other nutrients. What other
vitamins and minerals does a cat need? Is it better to
have more of these items. or can you have too much'?
- The bars on the Catchunks graph are shaded and there is a
picture ofa fat happy, cat there. How does
this affect the advertisement'?
- There is no mention of price or amount of cat
food.Catchunks may be more expensive than the average cat
food. How can you assess value for money?
Second March Advertisetnent
- They claim 'Up to 20% extra goodness'. More goodness than
what? Does this make it the best? What is 'goodness'? Can
it he measured?
June Advertisement
- What is the dotted line for? Why is it so steep? Is it
fair?
Can you find
any other errors in these advertisements?
Breakfast Cereals
You will need a sheet of graph paper.
Sly Sellers has been given information shown in Table 3 and Table 4 on a
new breakfast cereal, Sunwheat, and an average cereal.
Table 3 - Contents of Sunwheat
and the average breakfast cereal.
Table 4 - Sales of Sunwheat.
- Make up a misleading advertisement for Sunwheat.
Write down how you have misused statistics in it.
- Look at your friend's advertisement. Write down
how he has misused statistics.
Look again at the advertisements collected by the class.
- Write down all the mistakes and attempts to
mislead that you can find.
|