| How Many People?
Population
Explosion
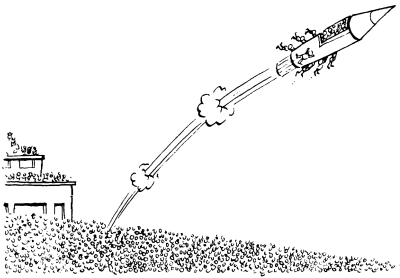
People sometimes speak of the 'population exploson'. This means a rapid increase in the
number of people.
Overpopulation is a growing world problem. Many countries are finding it more and more
difficult to feed and clothe their fast-increasing population.
- What do you think is meant by saying a country is overpopulated?
- Name two countries which you think are experiencing a problem with overpopulation.
Stick
Diagrams
Let us look at world population growth since the 1600s. Figure 1 is a digram showing world
populations for different years.
A stick man has been drawn for every 100 million people. (100 million people is about
twice the present population of England and Wales.)

Figure 1 - World population, 1690 to 1850.
Table 1 gives the information which was used to draw the three
diagrams of Figure 1.
(Source: UN Statistics)
Table 1 - World population, 1650 to 1950.
- Draw diagrams similar to those of Figure 1 for the years 1700,
1800, 1900 and 1950.

Projections
You will need page R1.
We are going to estimate the future population. Such an estimate is called a
PROJECTION.
- Plot the data of Table l onto Figure 6 on page Rl.
An extra piece of information is that the world population reached 4000 million in
1975.
- Put this information on to your graph.
- Draw a smooth curve to pass through all your plotted points.
- What do you notice about the slope of the curve?
Look again at Table l.
- Make a guess at what the population is likely to be in the year 2000.
Now turn back to the graph.
- Continue the curve (using a dotted line) up to and past the year 2000.
- How does the reading from the graph for the year 2000 compare with your guess from the
table?
Most people find it easier to project using a graphical method rather than the table.
- Copy and complete:
'Assuming that present trends of world population growth continue, my population
projection for the year 2000 AD is _____ people.'
How
Accurate?
The kind of projection we have just looked at is rough and ready and makes two
assumptions. First, it assumes that past and present measurements are accurate.
- Do you think that past measurements were as accurate as present measurements? If not,
why not?
- Give two reasons why present measurements may not be accurate.
The projection also assumes that present trends will continue in the future.

The six pictures above show ways in which world Population growth may be affected.
- Write down what the six illustrations represent.
How might they affect population growth?
- Add some more ideas of your own of things that could affect population growth.
- What do you think is most likely to slow down population growth?
How Much
Land?
Look back again at Your graph in Figure 6. It can be seen that the world population is
increasing very quickly indeed. But we need an idea of how quickly it really is
increasing.
How does it compare with the amount of land available? The land area of the world
(including deserts) is about 14 thousand million hectares. (A hectare is 10000 square
metres.)
- Using the information from Table 1 and A3h, copy and complete Table 2 and work out how much land there was for every person in those
years. The figure for 1650 has been entered for you.
Table 2 - Population compared with land area
The first entry of Table 2 is shown in the graph of Figure 7 on
page R1.
- Complete Figure 7 using the data in Table 2.
- What do you notice about the amount of land available per person?
- Write two sentences to describe what might happen in the future.
*One population projection for the year 2500 AD, based on present growth patterns, is
140 million million people. Land area is about 140 million million square metres.
- *How much land does this give for each person?
- *Why is this projection not likely to be anywhere near correct? What can you say about
future population growth trends compared with the present?
Why Has the
World Population Increased?
- Write out the two items from the list below which you believe most influence the size of
world population.
More people living in cities
More babies being born
More immigration
People living longer
More people working in factories
- Copy and complete:
'There is a population explosion because
__________
However, world population growth may be slowed
down by natural disasters such as __________
or changes in health patterns such as __________
|