|
Brief Description
This unit deals primarily with quality control, but the notion
of variability is central throughout. The unit concentrates on
one particular aspect of the quality control process - that
concerned with whether a stated minimum content is exceeded.
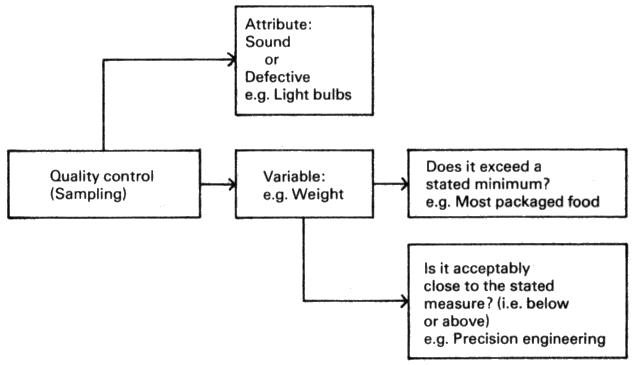
The quality control process
Quality control charts are employed to record information
obtained when data are obtained sequentially. The sample mean is
used as a representative measure of a distribution, while the
range is used to measure spread.
Design Time: About 5 hours
Aims and Objectives
On completion of this unit, pupils should be able to construct
quality control charts and interpret them in a simple way. They
will have practised calculating means, drawing histograms,
interpreting graphs and tables, using the range and obtaining and
recording data. They will have been introduced to calculating the
mean, using a change of origin.
The pupils should be more aware of the variability of weights
of packeted goods, the implications of the stated 'Minimum
contents' or 'Average contents' and some of the constraints
governing quality control. They meet examples of difficulties
arising in interpretation and comparison of statistics, of
thinking quantitatively in a disciplined way about everyday
affairs and of coming to decisions on the basis of statistical
arguments.
Prerequisites
Pupils should be able to draw axes for graphs, plot points and
perform simple operations with directed numbers. Subsection D2j,
which is optional, requires an awareness of percentages.
Familiarity with the mean and bar charts would make progress
easier but is not essential.
Equipment and Planning
Section A invites pupils to think about the notions
of 'Average contents', 'Minimum contents'and 'Overweight'and
provides a context for the work of the next two sections.
In Section B the pupils play two games to develop the
concepts of (i) overweights and (ii) the constraints governing
quality control, i.e. that production of underweights can lead to
legal action while that of overweights can lead to financial
problems.
About 250 (or at least 200) small cubes will be required by
each pair of pupils for the games. Larger groups can be used if
necessary. Beads, counters, small stones, plastic coins, small
squares of card will suffice instead of cubes but each group of
250 must be homogeneous. Some pupils can work on Section C
while others work on Section B to cut down the number of
cubes required.
In Section C, pupils find the mean overweight of a
sample of loaves (data supplied in text) and use page R1. They
progress to construct a quality control chart for eight such
samples. Graph paper is required. C3 is optional to
reinforce the ideas of this section.
The flow of the unit would not be unduly interrupted if
Section D is not continued until a later date.
In Section D bags of crisps are weighed. The
overweights are analysed by means of a quality control chart and
a histogram. D4 is an optional section in which the mean
for ratio data with class intervals is calculated using a change
of origin. This section and D2j may not be
suitable for weaker pupils.
Twenty-five bags of crisps and a fast weighing balance
accurate to 1g will be required for each group. The number of
groups may be determined by the amount of equipment available. If
the collection of data is done as a class activity, it may be
started as pupils are approaching the end of Section C.
Graph paper is required, preferably of large size (to fit the
histogram next to the quality control chart.)
Detailed Notes
Section A
A1
This section lends itself to class discussion. Reference
may be made to packets of food at home, and some of these may be
used in the classroom. It may be worth emphasizing that as well
as expecting a lower mean for a packet marked 'Average contents
100 grams' than for a packet marked 'Minimum contents 100 grams',
this system is less easily checked by the customers, since they
will have no idea of what might constitute acceptable variation.
European practice incorporates tests which check that not more
than 1 in 40 of the packets weigh below a certain minimum. Price
may be lower for packets marked 'Average' rather than 'Minimum'.
A2
The precis of The Grocer article helps to set a
realistic context. The notion of the British practice of goods
sold by 'Minimum contents'is reinforced.
Section B
B1
The purpose of the game is to help the participants
develop a concept of overweight. The variation in weights during
a production process is simulated by the pupils' estimates of
piles of 16 cubes made within a time limit. Their record of 'weights'
(asked for in a) is referred to in B2b.
You may need to demonstrate the game and explain the rules.
Sufficient counters should be made available to avoid undue
constraint.
B2
The introduction of a fine for 'underweight' loaves
shouia help to make the pupils aware of the two directional
nature of the constraints which govern quality control and
discourage the production of underweights. From the firm's
viewpoint, while underweight goods may be more profitable in the
short term, possible legal action and loss of reputation offset
this.
Consistently overweight goods may be costly or uncompetitive
if accounted for in the price. These points can be brought out in
a class discussion.
Section C
C1
From the sample of 10 loaves, the mean weight and the
mean overweight are calculated separately, underweights being
considered as negative overweights. The pupils are encouraged in
part f to deduce that:
Mean overweight = Mean weight - 400
This method is used later to find mean overweights. This idea
is used in D4 as a method for calculating means using a
change of origin, i.e.
Mean weight = Mean overweight + 400
where 400 has been subtracted to change the origin.
Questions j to m indicate
that a change of origin does not give a change of range; 428 -
394 = 34 = 28 - (- 6)
C2
Pupils use the method from C1f to find
the mean overweights for the eight samples and then construct the
quality control chart. The sequence of the points shows two basic
trends - downwards for samples 1-3 and upwards for samples 4-7.
The inference is that adjustments were made after sample 3 and
maybe sample 7.
The three charts shown below are suitable for reinforcement of
ideas on interpretation of charts and what action should be taken.
1 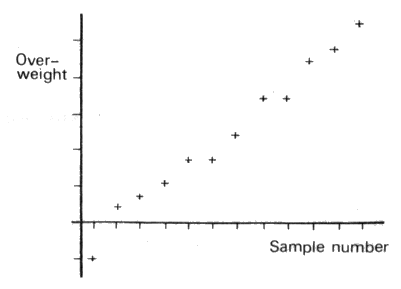
The general trend is for the overweight to increase. Action
should be taken to decrease the mean weight. Random variation
exists about the trend.
2 
The goods are consistently overweight. Again random variation
exists. Action should be taken to decrease the mean weight.
3 
The variability in overweights is progressively and
systematically increasing. Action should be taken to reduce this
variability.
C3
This section is optional and may be used as a
reinforcement exercise, perhaps for homework. It is similar in
nature to C2. The quality control chart, however,
indicates a downward trend in the number of matches being put
into boxes. The production manager will be alerted to a possible
fault by the non-random pattern emerging and should take action
to increase the number of matches being packed into a box.
Despite this, the overall mean for the eight samples is 40
matches per box.
Section D
The school tuck shop may lend the crisps, suitable balances
may be obtained from the science department.
Ideally all the bags of crisps should be (i) made by the same
firm, (ii) of the same flavour and (iii) stamped with a net
weight. Some aren't marked with net weight, but this information
may be obtained by telephoning the manufacturers. (Different
flavours have different weights, not because of the flavour,
which is only in the added salt, but because they come from
different production runs.)
D1
The pupils obtain the data themselves by weighing 25
bags of crisps and then calculate the overweights. If the actual
weighing proves impossible, the following data may be used:
Twenty-five bags of Walkers plain crisps (minimum contents 24.5
grams) were weighed. The mean net weight was 29.4 grams. The bag
weighed 2 grams (to the nearest gram), and the following are the
weights of bag and contents, to the nearest gram.
36 31 33 33 27
36 32 31 30 28
30 29 30 33 30
31 31 28 35 34
33 34 31 31 28
Alternatively, the above data could be used for a
reinforcement exercise.
D2
The work in this section assumes a minimum weight of 241/2
grams. However, if the only bags obtainable are marked with a net
weight equal to a whole number of grams, the scale on the chart
in Figure 2 will have to be offset by 1/2g
(i.e., to -31/2g, -11/2g,
1/2g, 21/2g, 41/2g,
etc.). This is because many of the weights will fall on the
boundaries between classes, thereby causing problems with the
histogram. The overweights calculated in the last section are now
analysed in a quality control chart and the variation in weight
of the middle 60% of the bags is measured using its range.
D3
The histogram is constructed alongside the quality
control chart to show the distribution of overweights. In c
the pupils are encouraged to find the mean overweight of the
distribution shown on the histogram. Technically, this is an
estimate of the mean as:
2 bags are assumed to be overweight by 1 gram,
7 bags are assumed to be overweight by 3 grams,
6 bags are assumed to be overweight by 5 grams, etc.
This may only be fully appreciated by the more able pupils.
D4
Parts a, b and c,
of this optional section serve to reinforce Section D3
in calculating the mean give-away weight. In d the mean weight of
a bag is deduced, i.e.
Mean weight of a bag = 24.5 + mean overweight
Thus the mean of the distribution of weights has been
calculated using a change of origin to 24.5. The large give-away
weight in f is to avoid any possibility of
prosecution.
This section is suitable for the more able pupils.
References
A. Huitson and J. Keen, Essentials of Quality Control(Heinemann,
1965).
M.J. Moroney, Facts from Figures, Chapter 11 (Pelican,
1951)
F. Mosteller et al, Statistics by Example; Book 3 Detecting
Patterns, pages 29-32 (Addison-Wesley, 1973)
Page R1
| Weight of loaf (grams) |
Overweight (grams) |
| 415 |
15 |
| 394 |
-6 |
| 408 |
|
| 422 |
|
| 428 |
|
| 397 |
|
| 425 |
|
| 406 |
|
| 414 |
|
| 421 |
|
| Total overweight |
|
Table 4 - Overweights of ten 400-gram
loaves.
| Sample no. |
Mean weight |
Mean overweight |
| 1 |
413 |
|
| 2 |
405 |
|
| 3 |
396 |
|
| 4 |
402 |
|
| 5 |
418 |
|
| 6 |
422 |
|
| 7 |
428 |
|
| 8 |
428 |
|
Table 5 - Mean overweights of eight samples
of loaves.
Weight of empty packet _____ grams.
Weight printed on packet _____ grams.
Weight of
full bag |
Net weight
of crisps |
Overweight |
| |
|
|
| |
|
|
| |
|
|
| |
|
|
| |
|
|
Table 6 - Weights of 25 bags of crisps.
Total no. of bags = 1000
Total give-away weight = _____.
Overweight
(grams) |
No. of
bags |
Mean overweight
(grams) |
Give-away
weight |
| 12 and under 14 |
6 |
13 |
6 x 13 = 78 |
| 10 and under 12 |
12 |
|
12 x ___ = ___ |
| 8 and under 10 |
86 |
|
___ = ___ |
| 6 and under 8 |
221 |
7 |
___ = ___ |
| 4 and under 6 |
320 |
|
___ = ___ |
| 2 and under 4 |
290 |
|
___ = ___ |
| 01 and under 2 |
63 |
|
___ = ___ |
| -2 and under 0 |
1 |
|
___ = ___ |
| -4 and under -2 |
1 |
-3 |
1 x (-3) = -3 |
1Zero means that the
packet contains exactly 24 5 grams.
Table 7 - Overweights of 1000 bags of crisps.
Answers
| A1 |
a and b |
See detailed notes. |
| |
|
|
| A2 |
a |
more than 400 grams |
| |
b |
4/5 |
| |
c |
Mean is likely to be more than 400 grams. |
| |
|
|
| B2 |
d and e |
See detailed notes. |
| |
|
|
| C1 |
a |
4130 grams |
| |
b |
413 grams |
| |
c |
15, -6, 8, 22, 28, -3, 25, 6, 14, 21
Negative means it is underweight. |
| |
d |
130 grams |
| |
e |
13 grams |
| |
f |
See detailed notes. |
| |
g |
428 grams |
| |
h |
394 grams |
| |
i |
34 grams |
| |
j |
28 grams |
| |
k |
-6 grams |
| |
l |
34 grams |
| |
m |
They are the same. |
| |
|
|
| C2 |
a |
No |
| |
b |
13, 5, -4, 2, 18, 22, 28, 28 |
| |
e |
Too heavy |
| |
f |
Samples 1, 2, 3 |
| |
g |
Sample 3. They increased the amount of
dough being used. |
| |
|
|
| C3 |
b |
Sample 1 |
| |
c, d, e, f |
See detailed notes. |
| |
|
|
| D4 |
a |
| Column 3 |
Column 4 |
| 13 |
6 x 13 = 78 |
| 11 |
12 x 11 = 132 |
| 9 |
86 x 9 = 774 |
| 7 |
221 x 7 = 1547 |
| 5 |
320 x 5 = 1600 |
| 3 |
290 x 3 = 870 |
| 1 |
63 x 1 = 63 |
| -1 |
1 x -1 = -1 |
| -3 |
1 x -3 = -3 |
| Total give-away
weight = 5060 |
|
| |
b |
5060 grams |
| |
c |
5.06 grams |
| |
d |
29.56 grams |
| |
f |
See detailed notes. |
Test Questions
- Bacon can be bought for the same price in packets marked
either 'Minimum weight 500 grams' or 'Average weight 500
grams'.
- What is the advantage to the customer of buying
the packet marked 'Minimum weight 500 grams'?
- What is probably true about the mean weight of
bacon in packets marked 'Minimum weight 500 grams'?
- A firm sells cheese in packets marked 'Minimum contents
250 grams'. Give one reason each why the firm does not
want to produce:
- many underweight packets,
- many greatly overweight packets.
- Tea is put into packets marked 'Minimum contents 125
grams'. A sample of five packets is taken from the first
batch of the day. The results of weighing each bag to the
nearest gram are: 128 grams, 126 grams, 127 grams, 124
grams, 130 grams
- What is the mean weight of tea in a packet?
- What is the mean overweight of tea in a packet?
- What is the range of these packets?
- The quality control chart in Figure T1 is for eight
samples taken during a day's production of biscuits. The
biscuits are in packets labelled 'Minimum contents 300
grams'.
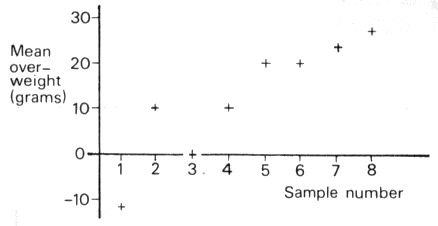
Figure T1 - Quality control chart
- Which samples, if any, had a mean weight per
packet of less than 300 grams?
- What was the mean weight per packet in sample 6?
- In one sample, the packets could be accurately
labelled 'Average contents 300 grams'. Which
sample is this?
- What action might the production manager want to
take to correct any fault in this process?
- Soap powder is packed in cartons marked 'Minimum contents
870 grams'. A sample of 10 boxes was taken every hour
during the day. The mean net weight of powder was
calculated. Table T1 shows the results.
Sample
number |
Mean net
weight
per packet (grams) |
Mean
overweight
per packet (grams) |
| 1 |
895 |
25 |
| 2 |
885 |
|
| 3 |
863 |
|
| 4 |
852 |
-18 |
| 5 |
875 |
|
| 6 |
877 |
7 |
| 7 |
865 |
|
| 8 |
872 |
|
Table T1
- The mean overweight of a packet in each sample is
listed in column 3 of Table T1. Complete this
column.
- Draw a quality control chart for these figures on
the axes in Figure T2 below.

Figure T2 - Quality control
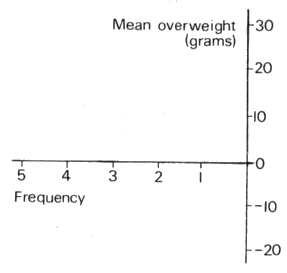
Figure T3 - Histogram
chart
- Calculate the mean overweight per packet for all
eight samples.
- The results from the first four samples show a
trend. Describe this trend.
- When samples 5, 6, 7 and 8 were taken, was the
process producing: cartons that were too heavy,
or cartons that were too light, or cartons that
were about right?
- The production manager took action during the day.
When do you think this was done?
- Draw a histogram on the right of the quality
control chart to show the distribution of the
mean overweights. Put the numbers on the axes
clearly.
Answers
| 1 |
a |
The packet is very likely to contain
more than 500 grams. |
| |
b |
The mean weight is likely to be more
than 500 grams. |
| |
|
|
| 2 |
a |
May be taken to court and fined or
suffer loss of reputation. |
| |
b |
Causes financial loss or is
uncompetitive if accounted for in the price. |
| |
|
|
| 3 |
a |
127 grams |
| |
b |
2 grams |
| |
c |
6 grams |
| |
|
|
| 4 |
a |
Sample 1 |
| |
b |
320 grams |
| |
c |
Sample 3 |
| |
d |
He would want to eliminate the
systematic increase in overweights, and reduce the mean
overweight. |
| |
|
|
| 5 |
a |
(25), 15, -7, (-18), 5, (7), -5, 2 |
| |
b |
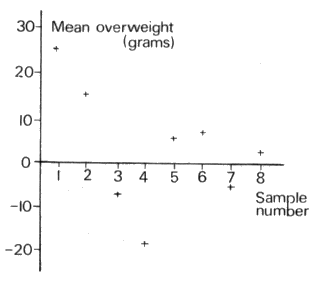
Figure T2
Figure T3
|
| |
c |
3 grams |
| |
d |
The trend shows that the mean net weight
per packet was decreasing over the period when the first
four samples were taken. |
| |
e |
About right |
| |
f |
After sample 4 |
| |
g |
See Figure T3. |
Connections with Other Published Units from the Project
Other Units at the Same Level (Level 3)
Car Careers
Phoney Figures
Net Catch
Pupil Poll
Multiplying People
Units at Other Levels in the Same or Allied Areas of the Curriculum
Level 1
Getting a Six
Probability Games
If at first...
Being Fair to Ernie
Practice makes Perfect
Leisure for Pleasure
Level 2
Seeing is Believing
Fair Play
Getting it Right
Level 4
Figuring the Future
Retail Price Index
Sampling the Census
Smoking and Health
This unit is particularly relevant to: Science, Mathematics,
Commerce, Social Sciences.
Interconnections between Concepts and Techniques Used in these Units
These are detailed in the following table. The code number in
the left-hand column refers to the items spelled out in more
detail in Chapter 5 of Teaching Statistics 11-16.
An item mentioned under Statistical Prerequisites
needs to be covered before this unit is taught. Units which
introduce this idea or technique are listed alongside.
An item mentioned under Idea or Technique Used is not
specifically introduced or necessarily pointed out as such in the
unit. There may be one or more specific examples of a more
general concept. No previous experience is necessary with these
items before teaching the unit, but more practice can be obtained
before or afterwards by using the other units listed in the two
columns alongside.
An item mentioned under Idea or Technique Introduced
occurs specifically in the unit and, if a technique, there will
be specific detailed instruction for carrying it out. Further
practice and reinforcement can be carried out by using the other
units listed alongside.
| Code No. |
Statistical
Prerequisites |
|
| |
None |
|
| |
Idea or
Technique Used |
Introduced
in |
Also
Used in |
| 1.1a |
Data collection from small population
simple data |
Sampling the Census |
Practice makes Perfect
Getting it Right
Leisure for Pleasure |
| 1.2a |
Using discrete data |
Seeing is Believing |
Shaking a Six
Probability Games
Leisure for Pleasure
Getting it Right
Net Catch
Phoney Figures
Sampling the Census
Being Fair to Ernie
If at first...
Fair Play
Car Careers
Multiplying People
Figuring the Future
Retail Price Index |
| 1.2b |
Using continuous data |
Seeing is Believing |
Practice makes Perfect
Getting it Right
Leisure for Pleasure |
| 1.3c |
Sampling from distributions and infinite
populations |
Getting it Right |
Being Fair to Ernie
Fair Play
If at first... |
| 1.4a |
Data by direct counting and measurement |
Shaking a Six
Leisure for Pleasure
Sampling the Census |
Being Fair to Ernie
Net Catch
Fair Play
Retail Price Index |
| 2.2a |
Bar charts |
Shaking a Six
Leisure for Pleasure |
Being Fair to Ernie
Seeing is Believing |
| 5b |
Reading bar charts histograms and pie
charts |
Being Fair to Ernie
Leisure for Pleasure
Car Careers
Multiplying People
Phoney Figures
Smoking and Health |
Seeing is Believing |
| 5d |
Spotting possible errors (outliers) as
not fitting general pattern |
Getting it Right
Multiplying People
Smoking and Health |
|
| 5v |
Inference from tables |
Leisure for Pleasure
Net Catch
Multiplying People
Phoney Figures
Figuring the Future
Sampling the Census
Retail Price Index
Smoking and Health |
Shaking a Six
Seeing is Believing
Practice makes Perfect |
| |
Idea or
Technique Introduced |
Also Used in |
| 1.3e |
Variability in samples |
Being Fair to Ernie
Fair Play
Net Catch
Probability Games
Getting it Right
Pupil Poll
If at first...
Car Careers
Smoking and Health |
| 2.2f |
Histogram for grouped data |
Leisure for Pleasure |
| 2.2j |
Plotting time series |
Car Careers
Figuring the Future
Multiplying People
Smoking and Health
Phoney Figures |
| 3.1c |
Mean for small data set |
Practice makes Perfect
Fair Play
Net Catch
Retail Price Index
If at first...
Getting it Right
Phoney Figures
Smoking and Health
Seeing is Believing
Car Careers
Figuring the Future |
| 3.1d |
Mean for small data set change of scale |
|
| 3.1f |
Mean for frequency distribution |
Seeing is Believing
Sampling the Census
Fair Play
Car Careers |
| 3.2a |
Range |
Practice makes Perfect
Figuring the Future
If at first...
Phoney Figures |
| 3.2b |
Fractiles |
|
| 5c |
Reading time series |
Practice makes Perfect
Multiplying People
Leisure for Pleasure
Phoney Figures
Car Careers
Figuring the Future |
| 5e |
Comparing directly comparable data |
Practice makes Perfect
Retail Price Index
Figuring the Future
Smoking and Health
Sampling the Census |
| 5g |
Looking for sources of non-comparability |
Sampling the Census
Retail Price Index
Smoking and Health |
| 5t |
Costs and risks in decision making |
|
| 5z |
Detecting trends |
Practice makes Perfect
Phoney Figures
Car Careers
Sampling the Census
Multiplying People
Smoking and Health |
|